BioGRID Search Results Layout
This is an old revision of the document!
BioGRID Search Results Layout
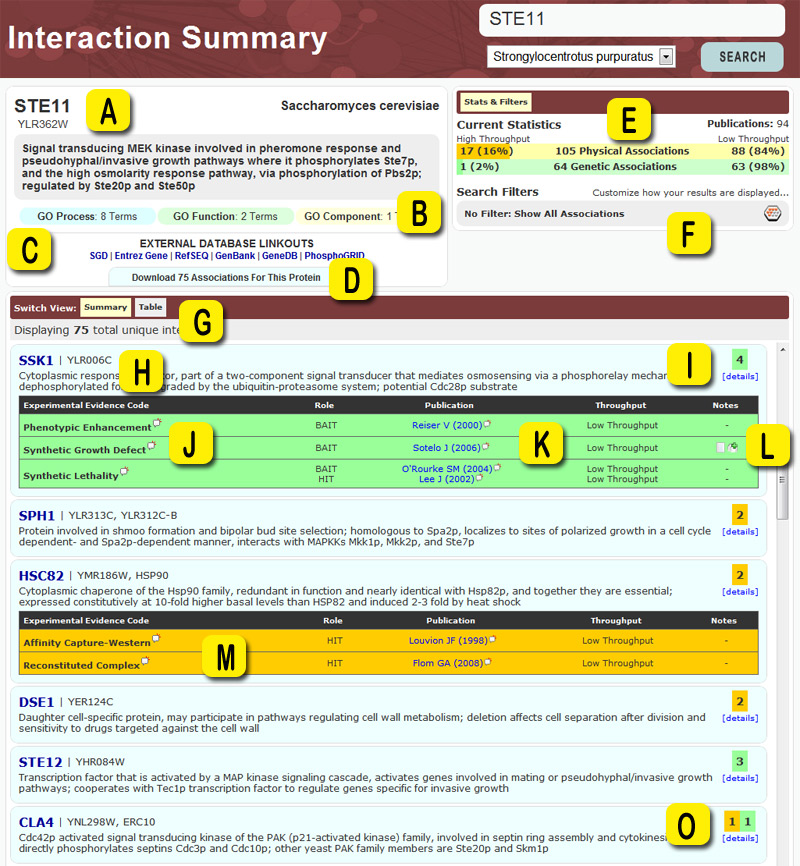
The following is an example layout viewed when searching for your protein of interest within the BioGRID. We've outlined all areas of interest with yellow letters, and defined what each area represents in the definitions at the bottom of the page.
Layout Legend
- A - Standard annotation data for search results including official name, aliases, synonyms, organism name, and description. The color surrounding the box (in this case navy blue) represents the organism and is different for each (in this case the blue represents the organism Saccharomyces cerevisiae).
- B - External links to 3rd party databases. These links generally point to model organism databases like SGD, MGI, FlyBase, etc. and also large genome resources such as Entrez-Gene and Ensembl.
- C - Gene Ontology summary for the search result. If you're interested in seeing the full details for this result you can click the “view list” link to expand the GO Summary into a list of mapped GO Entries.
- D - Click here to download a dataset consisting only of interactions listed on this search result page.
- E - A quick summary of the number of interactions represented in the current results. In this case there are 72 protein interactions and 374 genetic interactions listed.
- F - This drop down field, when present, allows you to switch the current view and look at the data in an alternate format.
- G - Experimental system, Role, and Publication listings for each interaction. These results are grouped together to form a non-redundant set of results. Interactions listed in Orange denote physical experimental systems and interactions listed in green denote genetic experimental systems. All results are ordered based on confidence in the experimental systems and the number of times the interaction has been reproduced.
- H - Annotation data for each of the resulting interactors with your search result. As above, the interface provides official names, aliases, descriptions, and Gene Ontology categories.
- I - Each interactor is hyperlinked to allow for circular searching. Simply click on the name and you will automatically pull up all curated interactions involving that particular gene, without having to redo your keyword searching.
- J - Sources show the first authors last name and the date in which the publication was published. You can click on these publications for more details and also to download a dataset of interactions reported by that publication.
